Category: PPC

What marketers should know about Google’s Performance Max campaigns

More and more marketers are turning to Performance Max, Google’s goal-based ad campaign format that helps target customers that are most likely to convert. Its automation capabilities have made it an inviting option for those looking to enhance their Search campaigns.

“It’s a new goal-based campaign that aims to increase online sales, generate more leads and drive more store visits to physical business locations,” said Rodney Ip, global product lead of Google Ads, at SMX Next. “It’s designed to run alongside keyword-based search campaigns as well as your Awareness and Consideration campaigns so you can easily drive more conversions across the full range of search, display, YouTube, Gmail, and Discover formats, all from a single campaign.”

“Performance Max puts your business goals front and center, and prioritizes these above other signals by inputting your specific conversion goals,” he added.

Performance Max is designed to complement keyword-focused search campaigns through automated bidding and targeting. Marketers looking to expand their customer reach and place greater emphasis on goal completions won’t want to ignore all that these campaigns have to offer.

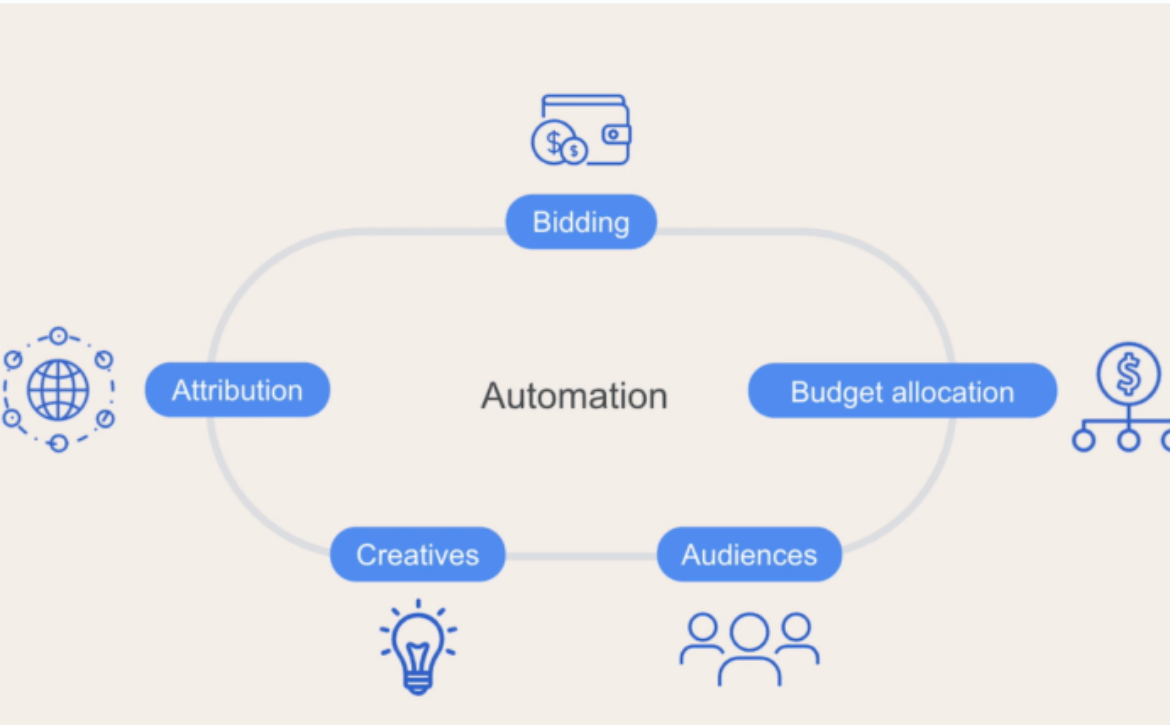
Automated bidding and targeting through cross-channel optimization

“Users help Performance Max understand what conversions matter most to your business,” Ip said. “Thanks to this focus on goals, Performance Max campaigns will leverage automated bidding and targeting technology, data-driven attribution, and automatically tailored ads to help you find more customers wherever they are across Google Ads.”

“Automation can help you invest your budget more effectively and dynamically allocate spend where the highest ROI opportunities are,” he added.

Source: Rodney Ip

Ip illustrated the benefits of cross-channel automation by using a fishing analogy: fishing in multiple ponds versus fishing in the ocean. Using single-channel campaigns is much like the former; you may catch a big fish but it’s difficult to know if you’re missing other big fish in the other ponds.

The answer to this dilemma, says Ip, is Performance Max’s cross-channel optimization capabilities.

“Cross-channel optimization in Performance Max is a lot more like fishing in the ocean,” he said. “With all of Google Ads’ inventory combined, you can use automation and Performance Max to cast a wider net in one body of water where you can easily catch all of the biggest fish. Use Performance Max to find new customers wherever they are and simplify your campaign management.”

Here’s what marketers should have on hand to ensure the Performance Max campaign automation sticks to their goals:

  • Conversion value rules for reporting.
  • Audience signals that unveil user intent.
  • High-quality text, videos, and images.

Performance Max conversion best practices

Ip noted a few best practices to help marketers improve conversion quantity and quality. These can help marketers get the most out of their campaign setups.

Choose actionable conversion goals. Not all campaigns will have the same goals, so marketers should make sure those they input are valuable to their organization.

“For example, if lead farms, phone calls, and store visits all contribute to your sales, make sure performance Max campaign is targeting and optimizing towards these specific goals,” Ip said. “This results in being able to maximize your marketing outcomes.”

Set conversion values. Ip recommends using value-based bidding strategies to help determine the worth of conversions wherever they occur.

“Set values to represent the relative importance of different conversion goals,” he said. “This helps Performance Max automation understand and prioritize the conversions that are most important for your business.

Import offline conversions. Many conversions take place in offline spaces. Performance Max campaigns allow you to import these and measure them alongside online conversions.

“For lead gen advertisers, you can also pair Performance Max with offline conversion imports,” said Ip. “Providing this data about which leads result in sales will help performance Max drive higher lead-quality across channels.”

Performance Max highlights the shift to automation in digital advertising. Marketers looking to get ahead of the game would be wise to see what these campaign types have to offer.

“We’re so excited that we’ve hit this milestone of launching performance packs to all advertisers,” Ip said. “We will continue investing in it and building new features to make it even easier to understand and manage your campaign to drive better results.”

Watch the full SMX Next presentation here (free registration required).

The post What marketers should know about Google’s Performance Max campaigns appeared first on Search Engine Land.

Read More
Jason March 14, 2022 0 Comments

Google launches automated vehicle ads

Google will roll out vehicle ads to all U.S. advertisers beginning this month, the company announced Friday.

An example of vehicle ads in the Google search results. Image: Google.

Vehicle ads will roll out to advertisers in more countries at an undisclosed “later date,” Google said in the announcement.

How vehicle ads work. Vehicle ads are designed to allow auto advertisers to promote their entire vehicle inventory to potential customers on Google.com. This format includes an image of the vehicle, make, model, price, miles and the advertiser’s name (shown in the example above). 

Google matches users with vehicle ads by using the details included in the advertiser’s vehicle inventory data feed (more on that below).

When a user clicks on a vehicle ad, they’re taken to the vehicle description page on the advertiser’s site. There, they can learn more and fill out a lead form. Advertisers can select which actions to measure, such as leads or store visits, and assign them a value.

Advertisers cannot use vehicle ads to promote vehicle parts, accessories, tires or services.

How to get started. To use vehicle ads, advertisers must create a vehicle inventory data feed and connect it to Google Merchant Center. This feed includes data on makes, models, prices, mileage and condition.

vehicle data in Google Merchant Center
Image: Google.

Since this is done through Google Merchant Center, advertisers can track metrics like clicks over a given time period.

Why we care. Car prices have remained high as a result of supply shortages associated with the pandemic and increased consumer demand. And, last year, 16% of new car buyers purchased their car online, up from just 1% three years prior, according to Google.

Vehicle ads may help advertisers get in front of high-intent audiences. “Advertisers who complemented their existing Search campaigns with the vehicle ads beta saw a +25% average increase in conversions,” Google said in the announcement.


Get the daily newsletter search marketers rely on.

Processing…Please wait.


Google’s not the only one with vehicle ads. Advertisers in this vertical may also be interested in Microsoft Advertising’s Automotive Ads, which also use data feeds to match ads to users’ searches and shows similar information.

The post Google launches automated vehicle ads appeared first on Search Engine Land.

Read More
Jason March 11, 2022 0 Comments

5 things your Google Data Studio PPC Dashboard must have

If you’re just getting started with Google Data Studio, you’ve probably experienced blank-page syndrome.

You get your data source connected, open up a new file, and you have no idea what to do next.

There are no instructions. No guide rails. Just you and an empty page to fill.

And while you can start with a template (Google Data Studio Report Gallery has several), it’s still tough to know how to customize it to perfectly fit your needs.

Here are some tried-and-true elements to include in PPC dashboards and reports that will banish blank-page syndrome and give your stakeholders the insights they crave.

1. Titles, subheads and context

When you add a chart in Google Data Studio, you select the data source, dimensions, metrics and date range from the Data Panel to populate your visualization.

But your reader doesn’t see the Data Panel and won’t know what your chart is about unless you take an extra step to include it in your dashboard.

The two graphs below show identical data visualizations. Figure A includes only the chart, while Figure B includes written titles and context.

Figure A leaves questions in your reader’s mind that Figure B answers.

You can make your graphs and tables easier to understand at a glance with these tips:

  • Give your data visualizations a title.
  • Use subheadings and microcopy for additional context.
  • Use legends.
  • State the date range if it’s not included in the chart. (Note: “auto” date range defaults to last 28 days.)
  • If multiple data sources are used throughout your dashboard, clarify which is used in specific charts.

How to do it:

  1. Add a text box and write out your titles and descriptions.
  2. This will open up a “Text Properties” panel to edit fonts, text size, and styling elements.

It’s worth the small manual effort it takes to add a text box and include context!

2. KPI scorecards

You don’t need an article to tell you that your dashboard should include your key performance indicators (KPIs).

But while you’re planning out your dashboard, pay special attention to where to include them.

Your KPIs matter most in your report and deserve top billing.

That means showcasing your KPIs with scorecards like so:

Not as afterthoughts at the end of a table:

Not only do tables make it hard to identify KPIs, for languages that are read left to right, tucking KPIs on the far right of the table tells your reader these metrics are low priority.

Keep your reader focused on your key growth metrics like lead volume, revenue, or return on ad spend (ROAS), rather than vanity and traffic metrics like impressions and clicks.

How to do it:

  1. Use Chart > Scorecard.
  2. In the “metric” section of the Data Panel, add your KPI. Repeat as needed.
  3. Control format and size in the Style Panel.

Having KPIs appear in tables and other charts isn’t a problem, but give them added attention by using scorecards.

3. Goal pacing

Some advertisers use fixed monthly or annual marketing budgets with no room for adjustments.

Others have sales or efficiency goals they need to hit with flexible budgets.

No matter what the approach, your dashboard should answer the question:

Are we meeting our objectives, and how do we know?

Account objectives aren’t standardized, and neither is the approach for including goal pacing in your dashboard.

Fortunately, Data Studio gives you many options for adding objectives and pacing, from literally charting against a goal to adding a written description of the target.

Here are some examples of how you might anchor performance to a goal:

How to do it:

  1. Option: Add a header that states the objective
  2. Option: Use a pacing chart such as bullet or gauge
  3. Option: Add a calculated field with progress to goal (metric/target)

Including goal pacing gives your reader confidence in how to interpret performance data.

4. Trends and historical comparisons

Trends and historical comparisons let your reader know if things are improving – or need improvement – over time.

Maybe you fell short of the goal, but you always miss it because it’s unrealistic.

Maybe you hit your goal, but you’re down compared to last year, and you need to take corrective action.

Don’t make your reader wonder whether current performance is average, down or “best month ever.”

Snapshot (single-metric) comparisons

Tables and scorecards give you an easy way to show your reader how performance for this period compares to another, using color-coded arrows to indicate the direction of the change (delta).

How to do it:

  • Under “Date range,” select your comparison date range:
    • Fixed
    • Previous period
    • Previous year
    • Advanced
  • In the Style Panel:
    • Control the color of positive or negative change arrows
    • For Scorecards only, you can select whether to show absolute or percentage change and whether to include a description of the previous time period (comparison label).
    • You can also format Scorecards to show both YoY and MoM comparisons.

Line charts

You can get a complete picture of performance trends using time series charts. 

Rather than just comparing this period to the last period, you’ve got an entire history revealing trends in seasonality, market impact and more.

You can use a continuous Time series chart (shown above) or designate a comparison time period.

Here’s how that same data looks as a Year over Year (YoY) Time series chart. Note that the comparison year will show as a lighter shade of this period’s line:

Another way to show historical performance is with a line chart that uses a time period as a breakdown dimension.

This Line chart is from a report comparing CPCs before and during the Covid-19 pandemic:

How to do it:

  • To compare two time periods: Use a Time series chart and select a comparison date range.
  • To compare three or more time periods (shown here for years):
    • Select a Line chart
    • Set the “Dimension” to Month
    • Set the “Breakdown Dimension” to Year
    • Set the “Sort” to Month
    • Set the “Secondary sort” to Year

A few important notes for trends and historical comparisons – 

  • Only use these for your KPIs or metrics that directly contribute to your KPIs. Don’t add a CTR trend chart just for the sake of including a trend chart.
  • There’s almost never a reason to show daily granularity in these charts. Zoomed in that closely, you’ll miss the signal for the day-to-day noise. Look for trends at a monthly level.

5. Categorical tables

Okay, so tables aren’t that glamorous. 

But if your Data Studio dashboard doesn’t have a table, something’s probably missing.

Why? Because there are times when your audience needs to compare multiple categories across multiple metrics. And nothing does that more efficiently than a table.

Tables are great for comparing default categories like:

  • Campaigns
  • Ad groups
  • Keywords
  • Search terms
  • Final URLs

And depending on the complexity of your PPC dashboard, you can create tables for:

  • Engines and platforms
  • Channels and networks
  • Funnels / intent / stages of awareness
  • Brand vs. nonbrand
  • Pivots of time segments, conversion types, and other categories

How to do it:

  • Chart > Table (or Pivot table)
  • Dimension(s): the category or categories you want to compare
  • Metrics: your KPIs and supporting metrics
  • From the Style Panel, you can format your table to include heatmaps, bars and targets

It’s easy to build tables and add metrics, and it’s easy to get carried away. Exercise some restraint and limit the number of metrics in your table, so it remains useful to your reader.

Bonus: Shiny charts

Our list constrained us to five categories, but here’s one bonus for making it to the end:

Shiny charts.

What are shiny charts?

Shiny charts are visualizations that your audience loves and gets excited about, even if they’re not super actionable.

Your readers may not learn anything new, but they’ll feel like they learned something new.

Maps are a great example. 

Many dataviz experts say not to use map charts; there are better ways to communicate location data. 

But try to find a client or stakeholder who doesn’t love to see performance data on a map. Go ahead. I’ll wait.

Sure it’s a bit counterintuitive when you’re trying to build out an actionable dashboard. Maybe even a bit controversial. And you don’t have to do it. But a chart that makes your audience feel good just for seeing it has its own merit.

Putting it all together

While your Data Studio dashboard can technically include whatever you want, it should at a minimum include:

  • Title and context
  • KPI scorecards
  • Goal pacing
  • Historical comparisons
  • Categorical tables

These don’t need to (and can’t) all be discrete sections. One scorecard can include a title, KPI, pacing, and time comparison.

There are many other charts and visualizations that can take your PPC dashboard from good to great. Getting started with this list will set you up for success and give you a dashboard worth the time it took to build.

The post 5 things your Google Data Studio PPC Dashboard must have appeared first on Search Engine Land.

Read More
Jason March 10, 2022 0 Comments

Platforms that have suspended ads in Russia

Russia’s actions in Ukraine have prompted ad suspensions from nearly every platform that search marketers rely on to reach Russian audiences. At first, companies such as Google, Microsoft and Facebook started by restricting ads from Russian state media, but as the conflict continued, many have expanded those suspensions to include all ads that would be served to users in Russia.

Below is a list of platforms and their current policies with regard to the conflict in Ukraine. We will update this resource as platforms update their policies.

Search engines. Google and Microsoft Bing, the two leading search engines globally, have both suspended all ad sales in Russia.

  • Google: On February 27, Google suspended ads from Russian state-owned media outlets. On March 3, the company expanded the suspension to include all ads serving to users in Russia.
  • Microsoft: On February 28, Microsoft banned ads from Russian state-owned media outlets. On March 4, the ban was expanded to include all new sales of Microsoft products and services (not just ads) in Russia.

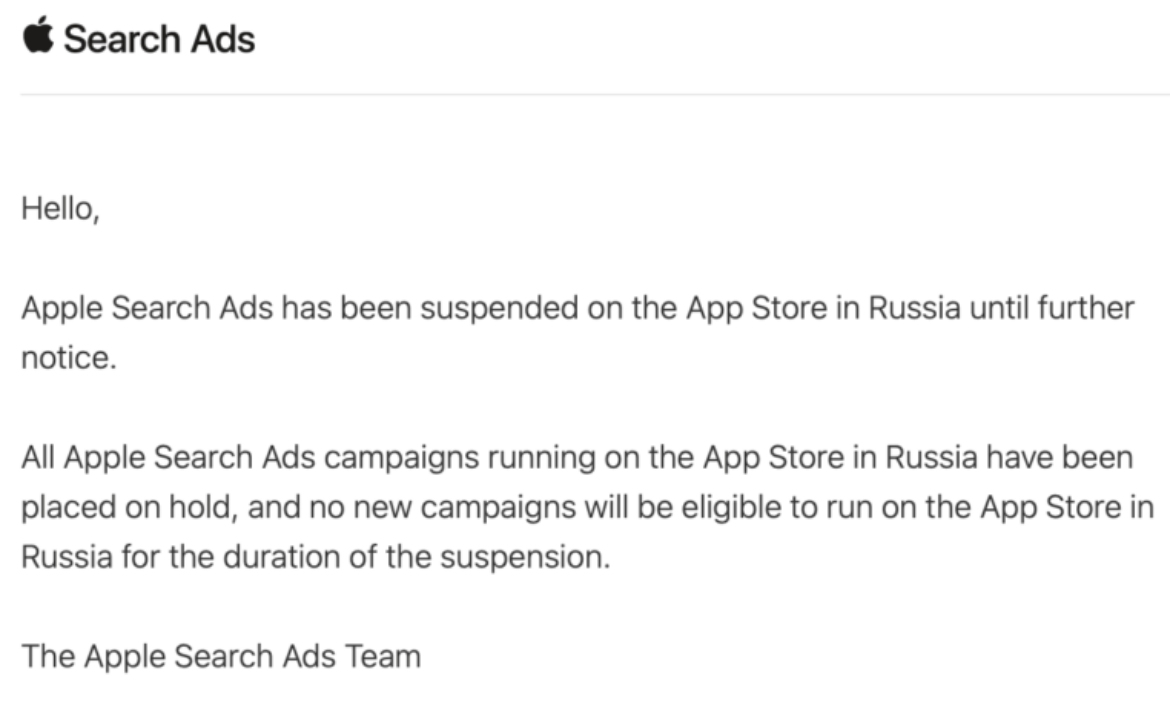
Microsoft Advertising powers ads on Bing, DuckDuckGo, Yahoo! and AOL, so brands currently cannot advertise to users in Russia on those platforms either. While Apple doesn’t operate a search engine, it has suspended Search Ads on the App Store in Russia.

An email sent by Apple to app developers notifying them that Search Ads in the Russian App Store have been paused.

Yandex, which is headquartered in Moscow and the second-most-popular search engine in Russia, is still operating normally.

Social media platforms. Most social media platforms have also rolled out ad suspensions similar to the ones mentioned above.

  • Meta: Facebook’s parent company paused ads targeting users in Russia on March 4. Several days prior, the Russian government announced that it would block its citizens from accessing Facebook, so ads may not have reached users anyhow. The company has not announced whether these changes will also apply to Instagram, but Meta has banned Russian state media from running ads or monetizing on any of its platforms.
  • LinkedIn: LinkedIn is owned by Microsoft and is therefore included in the company’s ban on sales of its products and services in Russia.
  • Twitter: On February 25, Twitter paused ads serving to users in Ukraine and Russia, citing the need to “ensure critical public safety information is elevated and ads don’t detract from it.”
  • Reddit: On March 2, Reddit announced that it is not accepting advertisements “that target Russia or originate from any Russia-based entity, government or private.” The platform has also blocked links from all domains ending in “.ru,” Russia’s country code top-level domain.
  • Snap Inc.: Snapchat’s parent company has stopped all advertising running in Russia, Belarus and Ukraine, the company announced on March 1.
  • TikTok: TikTok has restricted access to Russian state-controlled media accounts, but it appears it has not stopped serving ads to users in Russia.

Why we care. Platforms are responding to the conflict in Ukraine by halting ads as a means to cut down on noise and misinformation, promote the right sources of information and avoid potential brand safety issues. Unfortunately for brands and their audiences in Russia, this also means that there are fewer channels they can use to reach those customers. Knowing which channels are still available to you can help mitigate the impact of these ad suspensions. 

The post Platforms that have suspended ads in Russia appeared first on Search Engine Land.

Read More
Jason March 9, 2022 0 Comments

Microsoft Advertising announces new ad type for service providers

Microsoft Advertising has announced Professional service ads, a new ad format designed for service providers such as insurance agents, realtors and so on. Professional service ads are currently available as a pilot in the U.S. and Canada.

Examples of Professional service ads. Image: Microsoft Advertising.

Professional service ads can also be used to promote regional offices, branches or even national brands that provide relevant services. The format is available to comparison sites as well.

Why we care. This ad type may offer greater efficiency for service providers. In the early stages of this pilot, advertisers using Professional service ads were able to increase conversion rates by about 60% when compared to regular text ads, according to Microsoft. The average CPA decrease was 67% compared to overall performance in advertiser campaigns, the company said. But performance can vary, so it’s important to test the waters for yourself to see whether this is the right vehicle for your campaigns.

Some may see this as a competitor to Google’s Local Service Ads (LSAs) — while Product service ads may show for similar queries, there are some major differences to be aware of. For example, advertisers must be certified as “Google Guaranteed or “Google Screened” to participate in LSAs, which involves licensing, insurance and background checks. There is no such requirement for Microsoft’s Product service ads.

The format is new, but not really. Microsoft Advertising has been on a streak, releasing automated, vertical-specific ad types that leverage feed data to match offers to searches. The company now has ad formats for cruises, cars, tours and activities, credit cards and health insurance

Like those other ad types, Professional service ads will appear in the right-hand rail of Bing search results, alongside mainline text ads.

Microsoft plans to expand on Professional service ads. “We’re expanding to tax services and new markets, but expect to see more professional services, both in and outside of the financial service industry, coming to Microsoft Advertising in the future,” the company wrote in the announcement. 

The post Microsoft Advertising announces new ad type for service providers appeared first on Search Engine Land.
Read More
Jason March 7, 2022 0 Comments

Geotargeting optimization: How region impacts your PPC results

Want to understand your paid search results? Geography is one of the most significant factors to analyze.

DIfferent words and brands mean other things based on location. For example, are you “soda” or “pop”? The same is true for brand names.

Read on to learn about geolocation results in paid search, how they vary and what to do with the variances.

Data: How PPC results vary across regions

For years I’ve had discussions with various brands about their performance by region. Should they be geotargeting? How does it impact bidding? Does it matter at all? 

I pulled a data set to see how performance varied by geographies over the past year. Let’s start by looking at how results vary across regions. To understand the variances, I indexed each metric against the campaign totals or averages. 

How much do the metrics vary? The first thing that jumps out is how wide the variance is, especially for CTR. We saw variance for all metrics of at least 2x and in the case of CTR as high as 15x. The minimums also vary much more than the maximums, except for CTR.

There was a significant difference by geographic region (in this case, “geographic region” means “states”). Why the big swings? Among the reasons;

  • Brand awareness: Brands signify different things to different people based on locations. For example, a brand may be available nationally, but they were founded on the East or West Coast. 
  • Market competition: Regional players might only advertise in a given region that will influence the metrics.
  • Keyword/bid strategy: The paid search managers of these accounts on a daily basis have something to say about the performance. They shift bids and keyword lists based on performance as a regular part of maintenance. This can have a natural influence on the metrics.

Get the daily newsletter search marketers rely on.

Processing…Please wait.


The next thing I looked at was what would happen if I stopped spending in the lowest-performing 20 states. What would be the impact on my metrics? 

A simple first step could be to stop spending the lowest-performing states. Using my data set, I viewed “lowest performing” by four categories:

1) Lowest conversion rates
2) Highest CPC
3) Highest Cost per Conversion
4) Lowest conversion rates

These categories all impacted the results pretty differently. Removing the lowest conversion kept the most revenue but didn’t improve the ROI.

Removing the highest cost per conversion improved the ROI the most but removed more than 30% of the total revenue. The impact on the ROI was pretty small, and the volume of results was reduced by up to 35%, based on this data. 

So what if you took the lowest-performing states and poured that spend back into the top 20 performing states? The hypothesis showed improvement with all four scenarios increasing revenue vs. the baseline results.

The best scenario was removing the 20 states with the lowest costs-per-conversion and investing more in the states with the lowest cost-per-conversion. However, even in that scenario, the ROI and revenue didn’t increase more than 4% versus the baseline index.

Many companies would be ecstatic about the opportunity to increase revenue by 4% without any incremental costs. But for others, the juice wouldn’t be worth the squeeze. 

What could alter this analysis?

  • Assumptions on assumptions: A big assumption is that spending at higher levels and assuming the same throughput rates. The CPCs, conversion rates, or any of the metrics would be altered, impacting the results.
  • Keywords within states: Viewing any of this data through the lens of only the geography doesn’t take into account all the other factors that weigh into performance. For example, even in a great performing state, there are specific keywords that are not performing well just as there are keywords in poor-performing states that are crushing it.
  • Landing page and ad copy experiences.
  • Brand type: Our data set has a mix of DTC online pure-plays and online/offline. I think local store mix and conversion types can all alter this analysis.

PPC actions to take?

Ultimately, the beauty of paid search is nothing operates in a vacuum. You have to consider the implications between the keyword, ad copy, bid, and landing page.

The correct answer isn’t just altering geotargeting. It takes the combination of these with audiences, time of day, device type and so many factors to truly drive results.

What I’m suggesting is that geotargeting can be yet another knob that can be dialed up and down and should be considered a critical optimization tactic. For example, if you want the ad copy and landing page to match the geography, geotargeting becomes more important from a user experience standpoint.

In some cases, it will complicate things to a level that doesn’t make the difference for your organization, and maybe a simple bid-modifier will do. In other cases, it could be the key to unlocking your results.

You can start simply with bid multipliers. My recommendation: dig into the data at this level, create a few tests and see if you can impact results in a meaningful way. Then you can determine if the test should be scaled up or back. 

The post Geotargeting optimization: How region impacts your PPC results appeared first on Search Engine Land.

Read More
Jason March 7, 2022 0 Comments

Master Google Ads conversion from clicks, to calls, to revenue

Have your Google Ads results plateaued in 2022? If your conversion rates need a boost or you’re struggling to reduce CPA while increasing revenue, you’re not alone. Join the Google Ads experts from Paid Search Magic and Invoca for this webinar to learn the latest best practices for jumpstarting Google Ads ROI in 2022.

Register today for “Google Ads Conversion Masterclass: From Clicks to Calls to Revenue,” presented by Invoca.

The post Master Google Ads conversion from clicks, to calls, to revenue appeared first on Search Engine Land.

Read More
Jason March 4, 2022 0 Comments

Google and Bing halt all ad sales in Russia

Google and Bing have expanded ad sales suspensions imposed on Russia due to its invasion of Ukraine. Google has temporarily halted ads from serving to Russia-based users, the company announced Thursday. Similarly, Microsoft announced that it will suspend all new sales of its products and services in Russia.

Why we care. The two leading search engines now prohibit ads targeting users located in Russia, cutting off the main channels western search marketers use to reach audiences there. This will affect brands advertising to Russian users, but Yandex (Russia’s second-biggest search engine by market share) remains an option.

These ad suspensions serve to protest Russia’s actions in Ukraine, but they also help search engines avoid brand safety debacles like misinformation campaigns making it through their automated systems and showing to users.

Escalating restrictions on Russian state-funded media. Last week, both search engines stopped running ads from Russian state-funded media outlets. In addition, Microsoft is “further de-ranking these sites’ search results on Bing so that it will only return RT and Sputnik links when a user clearly intends to navigate to those pages,” Brad Smith, president and vice chair of Microsoft, said in an announcement on February 28.

Perhaps this is what Russia wanted. Roskomnadzor, Russia’s communications regulator, has accused YouTube of running “advertising campaigns to misinform the Russian audience,” according to the Wall Street Journal. The Russian agency demanded that Google change its ad moderation policies and discontinue such ads.

The new ad suspensions are likely to primarily affect Russia-based businesses, but they may also put a temporary end to the ads Russia is complaining about.

Social media platforms halted ad sales in Russia, too. Snap Inc. and Twitter have both paused ads in Ukraine and Russia, with the former halting them in Belarus as well. Facebook has stopped serving ads from Russian state media, but (at the time of publication) is still showing ads to Russian users.

The post Google and Bing halt all ad sales in Russia appeared first on Search Engine Land.
Read More
Jason March 4, 2022 0 Comments

Want to speak at SMX Advanced? We want to hear your ideas

SMX Advanced, the premier conference for experienced senior-level search marketers, returns virtually this year on June 14-15.

As always, the educational event program will cover the most advanced and timely search topics in both PPC and SEO.

For the SEO track, we’re looking for session pitches on several different topics, including:

  • How UX, SEO and content must work in harmony.
  • The importance of technical SEO.
  • Ways to optimize content for rich results.
  • Case studies of scaling content with AI.
  • Frameworks for measuring ROI.

In the PPC track, we’re looking for sessions that address the loss of control marketers are feeling and the shift to fully automated campaigns, as well as measuring and reporting at a time when less data is available.

Even if you haven’t spoken before, consider submitting a session topic idea now. We are always looking for new speakers with diverse points of view. The deadline for SMX Advanced pitches is April 15!

Here are a few tips for submitting a compelling session proposal:

  • Present an original idea and/or unique session format.
  • Include details about what an attendee will be able to do better or different as a result of attending your session.
  • Include a case study or specific examples and explain how they can be applied in different types of organizations.
  • Be realistic about what you can present in 30 minutes. You can’t cover everything about your topic. Going more in-depth on a narrow topic is often more valuable to the attendee.
  • Provide tangible takeaways and a plan of action.

Jump over to this page for more details on how to submit a session idea, or directly to this page to create your profile and submit a session pitch.

If you have questions, feel free to reach out to me directly at kbushman@thirddoormedia.com. I’m looking forward to reading your proposals!

The post Want to speak at SMX Advanced? We want to hear your ideas appeared first on Search Engine Land.

Read More
Jason March 1, 2022 0 Comments

Google removed App campaign placement data from Ads and AdWords API reports

On January 5, Google removed all App campaign placement data from several reports within the Google Ads API and the AdWords API. “We made this change because the data provided didn’t fully represent the complete view of the placements that help developers monitor brand safety for their advertisers,” the company said in its announcement on February 28.

Why we care. Keeping an eye on where your ads show up can help you steer clear of unwanted placements and associations. If you’re looking for App campaign placement information in the reports (mentioned below), it won’t be there. Instead, Google advises that you reference the App Campaigns Brand Safety Placement report, which can be accessed via the Google Ads UI.

Where the data was removed from. Google removed App campaign placement data from the Google Ads API’s Group Placement View and Detail Placement View reports.

App campaign data was also removed from the AdWords API’s Automatic Placements Performance and Placement Performance reports.

AdWords API is on the way out. The legacy AdWords API is scheduled for deprecation on April 27. Developers must migrate over to the Google Ads API before then.


Get the daily newsletter search marketers rely on.

Processing…Please wait.


The post Google removed App campaign placement data from Ads and AdWords API reports appeared first on Search Engine Land.
Read More
Jason March 1, 2022 0 Comments