Google Ads has announced three changes to the way automated extensions – a type of ad extension that is created dynamically for your ad when it’s “predicted to improve your performance.”
Here’s what’s changing in Google Ads automated extensions:
1: Automated and manual extensions can be shown together. Starting in mid-March, automated extensions can be shown with manually created extensions. So if you have created two sitelinks manually, Google ads can show two dynamic sitelinks, for a total of four sitelinks.
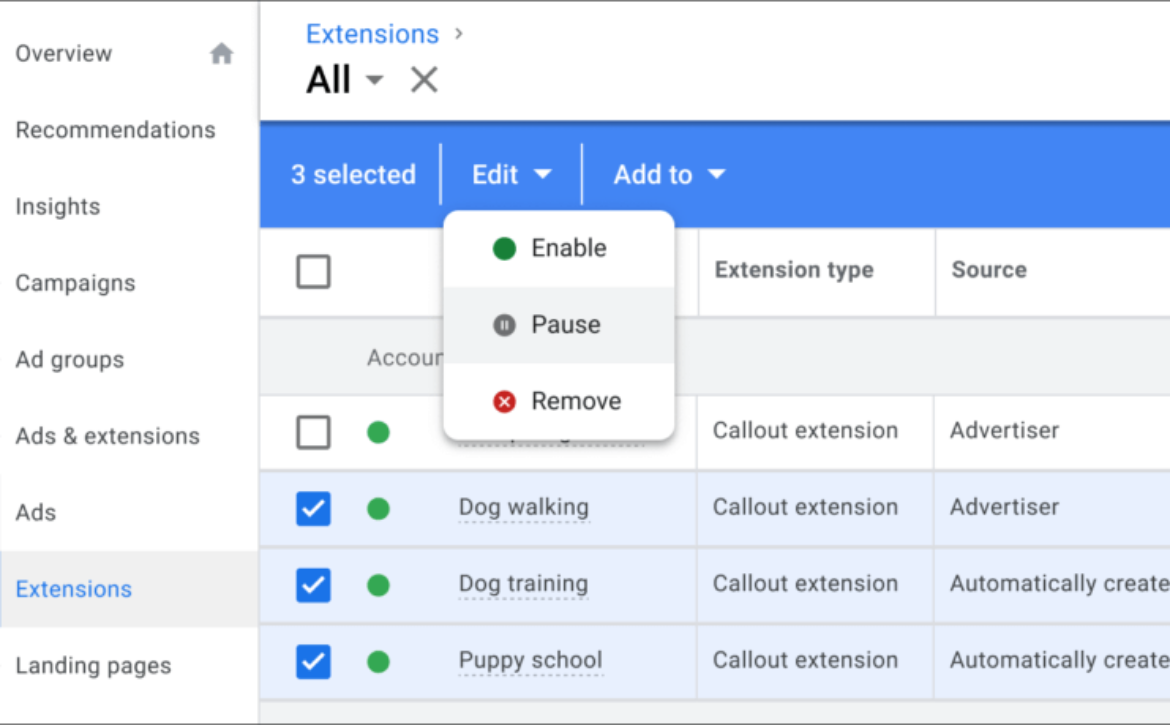
2: Reporting. In the coming weeks, Google Ads will provide a report for “Automatically created” extensions. You can view these in the table view of the Extensions page.
The Google Ads Extensions page.
3: Can be added at ad group, campaign, or account level. Also starting in mid-March, sitelinks, callouts, and structured snippets from higher levels in your account can serve with extensions of the same type from lower levels. Here’s a before and after from Google Ads that illustrates what this change looks like:
Google Ads before and after: how sitelinks will be served.
Why we care. In a keyword: click-through rate. Google said in their announcement that when four sitelinks advertisers can see a 20% higher CTR. As always, results will vary. So make sure to check the performance data of your automated extensions. You can always pause or remove any underperforming extensions.
Google is testing a new ad label in search results, the company confirmed to Search Engine Land. The experimental label (shown below) differs from the current ad label in that it is enclosed by a green box, which may help users distinguish it from organic results.
Image: Amir Shahzeidi.
Tip of the hat to Amir Shahzeidi for bringing this to our attention.
Side-by-side comparison. Below is an image, created by Greg Finn, comparing the experimental label (left) with the current label.
Image: Greg Finn.
In addition to being enclosed by a green box, the experimental label is not followed by any other text, unlike the example of the current label shown above.
Different tests, but related. In January, Google was seen testing favicons in text ads. Despite being quite different, this latest test is related to the same series of tests as the favicons.
“This is part of a series of small experiments to help users more easily identify the brand or advertiser associated with the Search ads they may see for a given query,” a Google spokesperson told us. “We are always testing new ways to improve the experience for users on the search results page, but we don’t have anything specific to announce right now.”
Why we care. Over the years, the design of Google’s ad labels has made paid listings trickier to distinguish from organic ones. However, this latest test seems to be a step back from that trend — it actually resembles the green, boxed label from 2017.
Whenever Google makes changes to the design of the ad label, those changes can impact clickthrough rates. Since this change might make it easier to identify ads, some advertisers may see a decline in CTR if the experiment receives a wider rollout.
However, others have not been able to replicate this test, so at this time, we’re not sure where else this label might appear (outside of app ads).
Evaluating a site for “quality” is the most misunderstood concept in SEO. As a result, you may be leaving sites out of your outreach that can drive ranking, or you may be including sites that will provide no value or potentially get you penalized. This presentation is for digital marketers who want to scale up a high-impact link-building program while lowering risk.
Join link-building expert Kevin Rowe, who will walk you through an in-depth analysis of what website elements need to be evaluated to determine “site quality” for link building.
On January 31, Google released the URL Inspection API, enabling you to programmatically check the status of URLs in bulk (based on properties you have access to in GSC). Although you could always inspect one URL at a time in GSC to see if a URL was indexed, this is the first time you can check the indexing status of URLs in bulk (based on data directly from Google).
The API opens up many opportunities to understand how Google handles your URLs. Also, it has been great to see the various SEO tool providers move quickly to add the URL Inspection API to their products.
Monitoring indexing status via the URL Inspection API and Analytics Edge
Regularly checking the indexing status of important URLs can help nip SEO problems in the bud. For example, using the API, you can check on a daily or weekly basis whether your most important URLs are still indexed. And you definitely want to know if important URLs drop out of the index, whether it’s a result of technical problems, quality problems, or Google’s finicky indexing system. That’s versus identifying that problem down the line after you’ve experienced lost rankings and traffic as URLs drop out of the index. And that’s if you pick up the drops quickly enough.
As soon as the API was released, I started thinking about a solution to periodically bulk-check important URLs. In addition, I started thinking about checking URLs across different sites. And going even further, I wanted to move beyond the 2,000 requests per day limitation (per property), which can be severely limiting for many larger-scale sites. In this article, I’ll cover the solution I’ve been using. It’s easy to set up and extremely cost-effective.
Analytics Edge, your SEO Swiss Army Knife
I’ve written heavily about using Analytics Edge for a number of scenarios in the past. It’s an Excel add-in that enables you to work with several APIs directly in your spreadsheets (and provides a ton of functionality for working with that data once exported). For example, it’s a great way to export your top queries and landing pages from GSC, create Delta Reports after major algorithm updates, and more. And now, you can use Analytics Edge to bulk check URLs via the URL Inspection API.
But it can do more than that.
By creating several macros, which can be grouped, you can link API tasks together to create a powerful recipe for checking the status of many URLs across websites (or GSC properties from the same site). I’ll cover more about moving beyond the 2,000 URL limit per day soon.
What you can accomplish via the URL Inspection API using Analytics Edge
In this post, you’ll learn how to check the indexing status of your most important URLs, across different websites, all at one time. Instead of just checking one GSC property in bulk, we’re going to do that across several websites automatically (without having to trigger each macro on its own).
The goal is for you to open a spreadsheet, click the “Refresh all” button, and have Analytics Edge check all your top URLs across multiple sites. It can save you a ton of time, while also providing critical intelligence about important URLs that are no longer indexed.
Overcoming the 2,000 requests per day limit
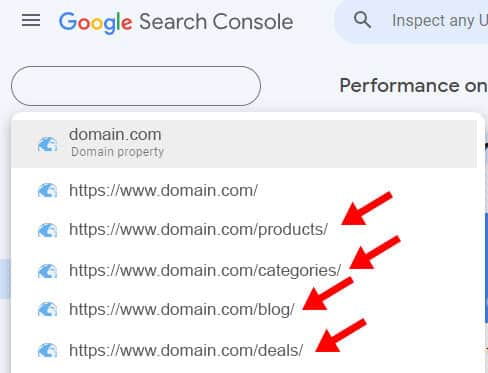
You can only process 2,000 requests per day via the URL Inspection API (per GSC property). But there’s an important distinction between “website” and “GSC property.” Remember, you can set up multiple GSC properties per website by adding directories and subdomains, which can give you more data (because the reporting will focus on just those directories or subdomains).
For our situation today, having directories or subdomains set up as properties will enable you to process 2,000 requests per day for each of those properties. That means you can check many more URLs per site if you have those additional properties set up. And using Analytics Edge, you can check the indexing status of URLs across those properties in one shot (using the process in this tutorial).
If you don’t need to check multiple websites, but want more requests for the one site you manage, then this can still help you get more data. So set up your top directories and/or subdomains. It’s easy, and more data awaits.
Tutorial: How to set up a multi-site indexing monitoring system using the URL Inspection API and Analytics Edge
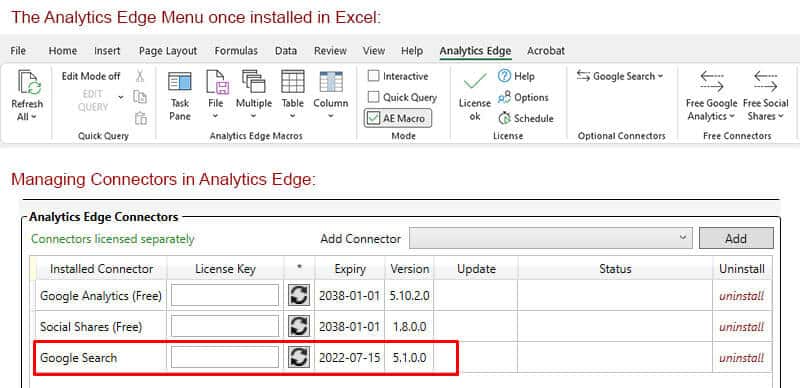
Step 1. Download and install the Analytics Edge core add-in. I have covered how to set up Analytics Edge several times in previous posts, and you can check those posts to learn how to do it. You should be up and running in no time. Once you install the core add-in, you can quickly add the Google Search Console connector. You will need both to accomplish what I am covering in this post. License-wise, there are free trials for both the core add-in and the GSC connector. After which, it’s $99 per year for the core add-in and $50 per year for the GSC connector.
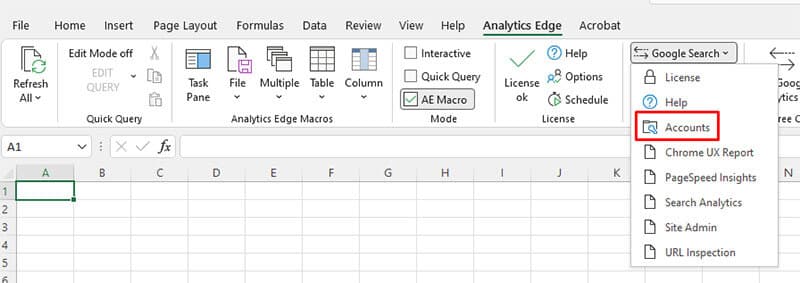
Step 2. Now it’s time to connect to your Google account that has access to the GSC properties you want to monitor. In Excel, click Analytics Edge in the top menu. Next, click Google Search. Then Accounts in the dropdown menu. Go through the process of connecting your Google account and authorizing access. This should only take a few seconds.
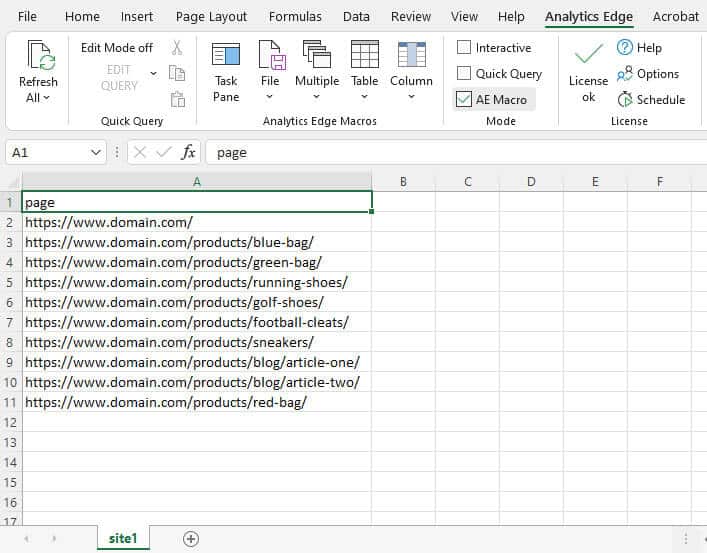
Step 3. Create a worksheet that contains the top URLs from the first website you want to monitor. You can include up to 2,000 URLs per worksheet. For this tutorial, I would only add the top 10 or 20 URLs for the site (so you don’t have to wait too long for the API to process your requests while building the system). After which, you can add up to 2,000 URLs per worksheet. Make sure the column has a header. I would use “page” as the header in this example so you can follow along. You can name the worksheet whatever you want, but I used “site1” for this tutorial. You could name each worksheet based on the site name.
Step 4. Next, we’ll create our first macro to check the URLs via the URL Inspection API. We’ll get to the second site after that (and then you’ll be able to run all the macros at one time). But for now, let’s focus on using the URL Inspection API to check indexing for the first list of URLs. Analytics Edge provides a ton of functionality you can use when crafting macros. You can explore the various menus to see everything you can accomplish.
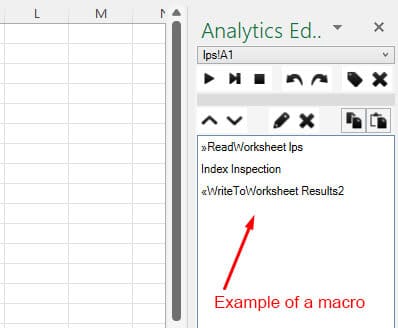
Step 5. When you create a macro in Analytics Edge, you combine a series of instructions that will run together (like a recipe). For our purposes, we want to first read in the list of URLs from our worksheet, then use the URL Inspection API to check those URLs, and then write the results to a new worksheet (so you can analyze the data).
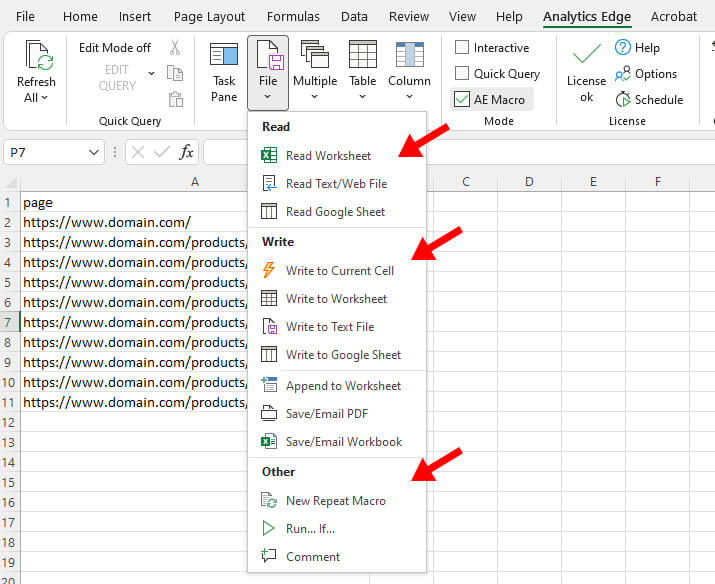
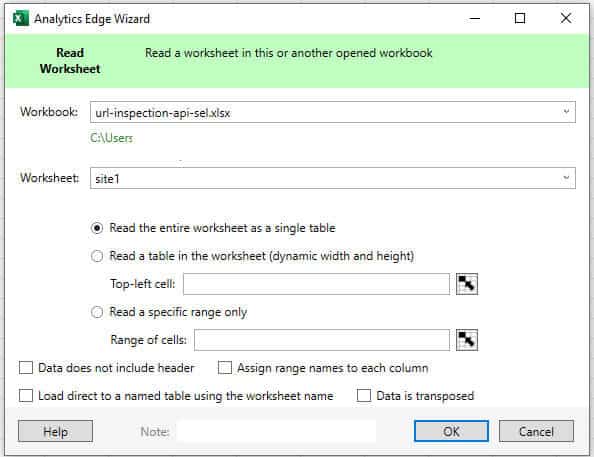
Step 6. In the Analytics Edge menu, click the File menu, and then Read Worksheet. This will pull the complete list of URLs you have in that worksheet. In the dialog box, the workbook will be the current workbook, and the worksheet should be the current worksheet. You shouldn’t have to change anything. Just click OK to read the worksheet. Also, notice how the Task Pane in Analytics Edge adds each part of our macro as we execute them. After each step, you will see the new instruction added to the macro.
Step 7. Analytics Edge creates a temporary worksheet named “Step Results” containing the list of the URLs you will process with the URL Inspection API. Next, let’s use the API. In the Analytics Edge menu, click Google Search, and then URL Inspection. In the dialog box, select the Account you set up earlier and then the GSC property you want to work with. Then you must tell Analytics Edge where the URLs are in the worksheet by adding the column name to the URL field. To add the column name, surround the name with brackets. So, if you used “page” as I did earlier, add [page] in the field. Then click OK.
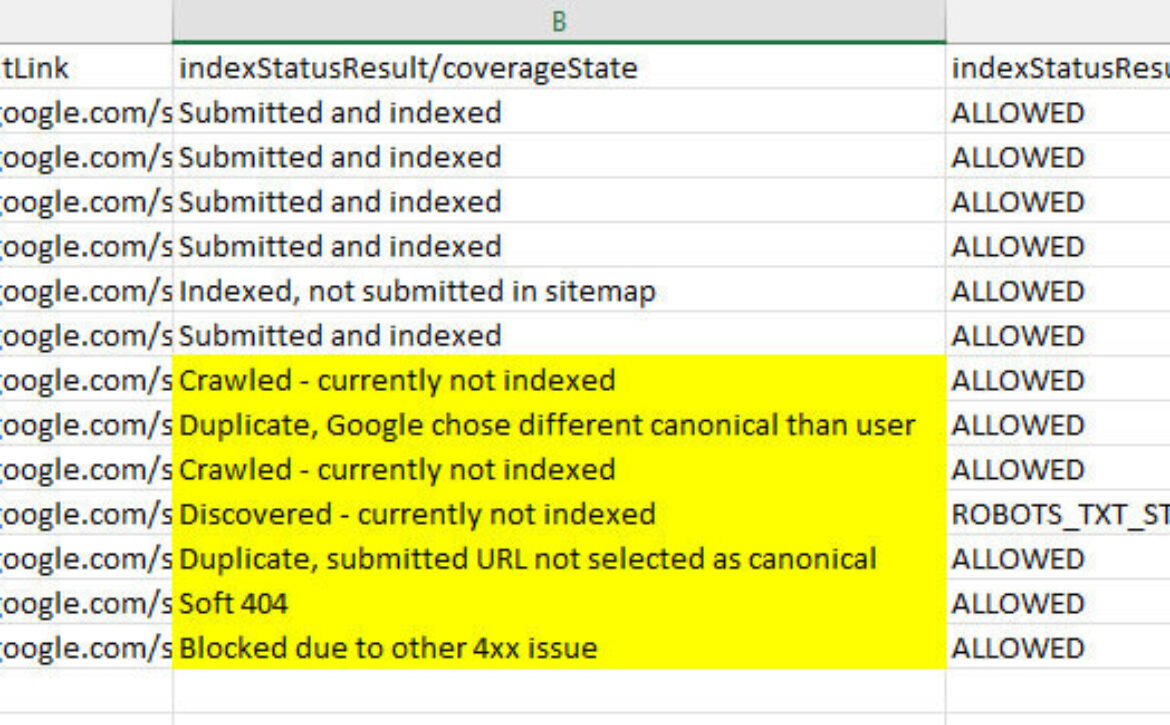
Step 8. Next, let the URL Inspection API process all the requests (which shouldn’t take too long since we’re only testing a handful of URLs). Once that’s done, the Step Results worksheet will contain a sample of the results highlighted in green. Next, let’s write the results to a new worksheet where you can analyze and work with the data.
Step 9. Write to Worksheet – In the Analytics Edge menu, click the File menu and then “Write to Worksheet.” Give your new worksheet a name like “site1 Results” and click OK. You now have a new worksheet containing the URL Inspection results for the list of URLs you want to monitor.
Step 10. We want to check multiple GSC properties in one fell swoop (across different websites). So, let’s create a second macro to do that (and then we’ll run them together via Analytics Edge).
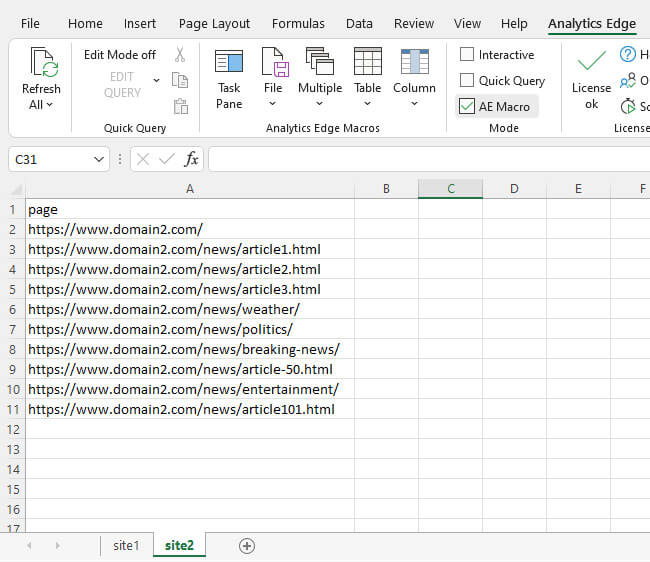
Step 11. Create a new worksheet with URLs from a second website (or second GSC property for the same site you ran earlier). You can name this worksheet “site2” for this tutorial. And again, you can name it by site if you want in the future. Add the top URLs from the second site you want to monitor. Again, I would add only 10 to 20 URLs. You can use “page” as the column name again.
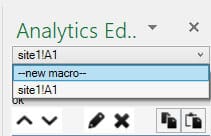
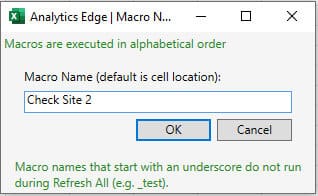
Step 12. Create a new macro that will work with this second list of URLs. The first macro is already set up and will work with the first worksheet of URLs. This second macro will use the new list of URLs. In the Task Pane for Analytics Edge, you will see your current macro. Click the dropdown and select “new macro.” Name is whatever you want. I called it “Check Site 2”. Also, if the Task Pane isn’t showing for some reason, you can reveal it by clicking the Analytics Edge menu and then Task Pane on the left side. It’s a large icon next to the File menu.
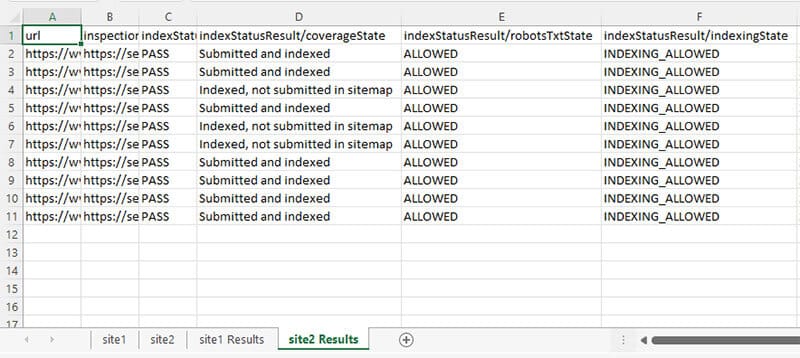
Step 13. Next, go through the same process we did earlier to create the instructions for reading the worksheet, using the URL Inspection API, and writing the results to a new worksheet named “site 2 Results”. You will have two macros that process URLs from two different worksheets when you’re done. And each macro writes the results to a fresh worksheet to analyze and work with the data.
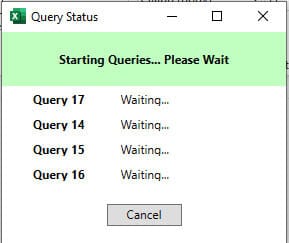
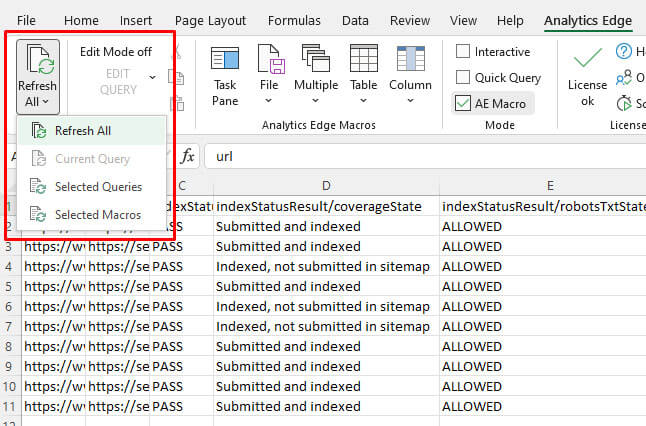
Step 14. How to monitor the URLs regularly – Now that you’ve created the two macros, you can always open the spreadsheet and run them at one time (to check the URLs you want to monitor across GSC properties). To do this, click the Analytics Edge menu and click the “Refresh All” button in the upper left corner. Analytics Edge will run both macros (in alphabetical order). Once the macros are complete, you’ll have fresh data to analyze. Save each spreadsheet with a new name so you can monitor your results over time.
Congratulations! You now have a multisite URL Inspection monitoring system.
You can add more sites to monitor by adding additional macros to the spreadsheet. And again, if you have a large site, then adding multiple directories or subdomains as properties in GSC will enable you to move beyond the 2,000 requests per day limit. So, you could add multiple GSC properties (from the same site) versus checking different sites.
Summary – Start with a simple URL Inspection monitoring system and expand from there
Ready to create your own system based on this tutorial? Then download Analytics Edge (the core add-in and the Google Search Console connector) and get a simple example working. Once you do, then expand your efforts by adding more GSC properties.
I think you’ll dig working with Analytics Edge, how versatile it can be, how fast it can work, etc. It’s a great way to monitor important URLs (across sites or properties). And feel free to ping me on Twitter if you have any questions while working through your first macros! Happy monitoring.
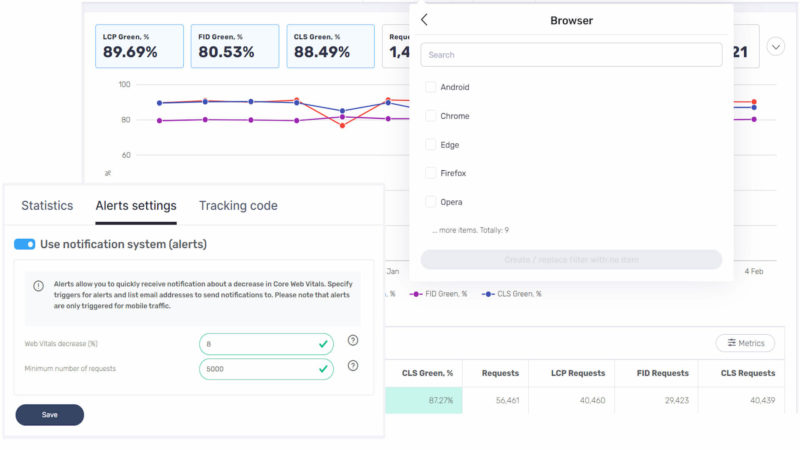
Core Web Vitals (CWVs) have already impacted search rankings for mobile, and with the desktop rollout now underway, they’re set to gain even greater importance for publishers. Due to complete by late March, we’ll see the familiar trio of CWV pillars incorporated as active measures for determining desktop search success – namely, first input delay (FID), largest contentful paint (LCP), and cumulative layout shift (CLS).
Why Core Web Vitals can no longer be ignored
According to a recent analysis of Chrome’s User Experience Report, Similar Web and global traffic data, only 31% of websites globally are compliant with all three CWV measures on mobile – just five percentage points higher than when CWVs became official KPIs for site evaluation last summer. But compliance with these user-centric metrics has never been more crucial – with those publishers that boost their search status able to drive higher visibility, traffic and revenue, as well as improved user experience. In fact, Google’s own research highlights major gains on mobile of up to 10% ad revenue uplift and 23% higher session duration.
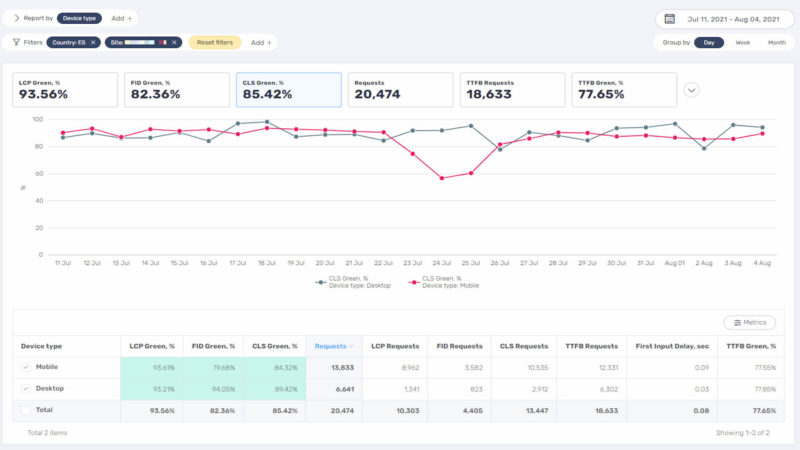
And while site owners might assume they’ll have an easier time with desktop – with its superior connections and faster processing – that’s not necessarily the case. Figures from the Chrome User Experience Report show that, of the top 1000 media sites globally, only 59% meet the requirements for CLS on desktop. That’s even lower than compliance on mobile, at 67%, and leaves publishers at risk of accidental clicks from readers – potentially leading to penalties from Google and a significant hit to revenues.
The risk of sudden changes
Even those with good scores can’t afford to be complacent: often, seemingly minor changes to a site, such as adding a new script or vendor, could cause a sudden drop in scores that isn’t immediately obvious.
For example, one of Clickio’s publisher partners saw a significant fall in their CLS score last July, shortly after making some changes to the setup of their Progressive Web App (PWA).
While there were seemingly no problems with the site’s performance or layout, Clickio’s Web Vitals Monitoring service showed that CLS on mobile had dropped from around 90% to under 60% in just a couple of days. However, by spotting the issue quickly, the publisher could test several solutions and fix the issues fast – before they showed up in Google’s Search Console or impacted the site’s search ranking.
In another case, a publisher working with Clickio had never paid much attention to Core Web Vitals and had not experienced any real issues. This was until last August when they suddenly saw a 16% deduction from their Google AdSense earnings due to invalid traffic.
With this increasing to a 26% deduction in September, the website owner was keen to get to the bottom of the problem and began to look into their Web Vitals scores with our real-user monitoring tool. This showed a CLS score under 60%, but after implementing a few quick CSS changes, the site was soon fully compliant again, with all three metrics above 90% and deductions from Google back to almost zero in November.
Four reasons publishers should set up real-user monitoring
With the desktop rollout bringing new challenges and Core Web Vitals metrics also expected to evolve over time, the only way for publishers to remain agile in the face of change is to set up real-user monitoring.
Specifically, real-user monitoring is vital for the following reasons:
1. Google says so– Despite the tech giant announcing its own Search Console report for desktop URLs, it has openly stated that this analysis doesn’t go deep enough:
“The data provided by Chrome User Experience Report offers a quick way to assess the performance of sites, but it does not provide the detailed, per-page view telemetry that is often necessary to accurately diagnose, monitor, and quickly react to regressions. As a result, we strongly recommend that sites set up their own real-user monitoring.”
Effectively, Google acknowledges site owners’ need for more granular data about how users are experiencing pages.
2. Track real user experience – In other words, publishers need field data. Distinct from lab data, which is gathered in controlled environments with unchanging device and network settings, field data gathers insight into what is happening in the real world, including the impact of varying factors such as differing location, device type, and network quality. With Google utilizing field data for its page experience rankings, publishers must prioritize this resource when learning how users experience their website.
3. Access real-time data – While Google’s tools are generally based on historical data, meaning site owners have to wait weeks for updates, real-user monitoring platforms are based on real-time, real-user data. This means publishers can see how their site performs in-flight and immediately take action. Some services, such as Clickio Web Vitals Monitoring, also allow site owners to set up email alerts – so they’re notified straight away if their vitals drop.
4. Identify specific problems – This ability to see, at a glance, whether a site is compliant with each of the three CWVs, means publishers can quickly spot when their site isn’t up to scratch. By drilling down by page, device, browser, and other dimensions, publishers can pinpoint exactly what needs fixing.
Time to act
The desktop rollout of CWVs is the latest wake-up call for publishers to enhance their site performance. With many already struggling on mobile, site owners now face the possibility of low scores across both environments if they don’t keep a close eye on compliance levels. By using real-user monitoring platforms, publishers can equip themselves with the information required to take stock of their site, understand the user journey, and take swift action to safeguard their search ranking – along with traffic and revenue.
Why not try Clickio’s Web Vitals Monitoring for free? Click here to sign up now, or contact us if you’d like to find out more.
With online customer engagement increasing, as the old saying goes, time is money! Customers who have access to fast responses, good customer service, and easy-to-use tools are more likely to do business with a company.
Did you know that businesses that use live chat features stand to see a threefold increase in sales and leads? When customers have access to speak with live chat representatives in real-time, they can get the fast responses they deserve.
Live chat features on your website can help to build positive customer relationships. They offer immediate solutions for a customer that wants to find out more about your company or your loan products. For this reason, live chat is one of the most important features your website can offer.
Ready to learn more about the ways that live chat on your website can drive business to your loan officers? In this guide, we’ll explore some of the top benefits of live chat tools.
Live Chat Improves Customer Service
Attracting customers means more than just offering the right products at the right rates. Lenders need to remain competitive by offering a variety of ways for prospective clients to get in touch with their teams.
Live chat representatives are often at the front line when it comes to a company’s reputation for service. They need to be able to quickly understand client expectations and challenges and interact in an engaging way.
Building a Reputation for a Fast Response
Live chat improves customer satisfaction rates, but it can also help to build brand awareness. Customers who have questions about your services and loan products are likely to reach out. If they aren’t able to get fast answers, clients are more likely to turn to your competitors.
How much does a fast response matter? Recent studies have shown that more than half of customers prefer a live chat feature over phone support!
Live chat makes it possible for a mortgage broker to answer customer questions immediately. This means that potential clients aren’t left waiting for hours to get a response to an email or spending a long time on the phone.
By offering these tools on your website, you can engage prospective clients in a meaningful way. This makes it more likely that they’ll turn to you when they’re ready to apply for a loan.
Provide Answers to Common Questions
Of course, even if you don’t have live representatives waiting to answer questions that come in through your website, you can take advantage of chatbots. These tools provide a friendly, fast response to common questions.
You can use chatbots when your teams aren’t available, like in the evenings or on the weekends. You can even have your chatbot ask a few questions to prequalify leads before one of your mortgage brokers reaches out to a potential client.
Want to Take Your Mortgage Brokerage Website to the Next Level?
Live chat features for websites will only get more popular in the future. If you’re looking for a high-quality CRM that can help you to generate leads, connect with customers on your website, and get loans through processing with ease, BNTouch can help! Request a demo of our powerful tools today!
Google is testing ad descriptions with bullets, Ginny Marvin, the company’s ads product liaison, confirmed via Twitter on Wednesday.
Image: Mark Williams-Cook.
In the screenshot of the test (above), we can see up to three bullet points within one ad. The bullet points in the example above show a mixture of descriptions and CTAs. Tip of the hat to Mark Williams-Cook for bringing this to our attention.
Why we care. Within ads, a bulleted list may be used to showcase unique selling points, product features or additional CTAs. The more relevant information you’re able to pack into an ad, the more likely it is that the ad will drive engagement — bullet lists can help keep that information scannable for potential customers.
Google’s confirmation. “Yes, this is an experiment to show ad descriptions with bullets,” Marvin said, adding, “We’re always experimenting and don’t have anything more to share on this at the moment.”
Other recent Google Ads tests. Google Ads is always testing out new features and ad formats. Over the last few weeks, the platform has also been seen testing favicons in text ads and, underneath the hood, global site tags with automatic collection. As is the case with bulleted descriptions, Google did not say whether these features will eventually receive a wider rollout.
Local news publishers could get some extra visibility and traffic – both from regular search results and Google News Showcase, Google announced today.
Google ranking improvement. Google announced an improvement to its ranking systems. This change is meant to help searchers discover stories from “authoritative, relevant local news sources.” Google also said this change means local news publications should appear alongside national publications in places like Top Stories.
Google News Showcase panels. Publishers who are part of Showcase program can now decide which content appears in their local news panels on Google News. Basically, it’s an easy way for publishers to highlight what they consider to be the most important news of the day.
Google News Showcase is Google’s content-license program that pays publishers to curate content via story panels. Since launching News Showcase in October 2020, Google has signed deals with 1,200+ news publications in more than a dozen countries.
You can find the local section of Google News on the left side navigation or in the local section of the For You feed in the Google News app.
Google News Showcase real-time reporting: Also in today’s announcement, Google mentioned that it recently began letting publishers see, in real-time, how readers are engaging with their Showcase content. Google said this data can help publishers quickly respond to what’s trending, add more context to stories, or add related panels to stories gaining traction.
Why we care. All of this is potentially good news for local news publishers. Google provides a significant portion of traffic to publishers – but they are often competing with large, national media brands who dominate Google News and the regular search results. Every publisher’s goal is to grow their traffic and audience. So long as you are publishing high-quality stories and doing proper news SEO, the opportunity is there for you to seize.
Like you didn’t have enough messages in your Google Search Console message panel, now you will be possibly receiving even more. Google said it has “finished the migration of all the messages into the new Search Console interface.” As a result of this, you should expect even “more user messages in the messages panel,” the search company said.
More details. When Google rolled out the new Google Search Console in 2018, not everything was migrated from the old to the new platform. In fact, there are still several tools in Search Console that are not yet migrated. In 2019, Google revamped the Search Console messages into a bell icon in its own panel. But not all messages were found in that section when that launched. Now, all messages should be accessible in that message panel.
The announcement. Here is Google’s announcement as posted on Twitter with a screenshot:
We’re happy to let you know that we finished the migration of all the messages into the new Search Console interface – look out for more user messages in the messages panel. More info https://t.co/PNVic5UXompic.twitter.com/VX5QyZXEBz
Why we care. It is now easier for you to see all the messages you would be getting from Google Search Console in one place. It might be a bit overwhelming to see all these messages, but don’t worry, scan through them and anything that seems concerning or important, speak to your SEO consultant, agency or developer for their assistance.