How to prepare for an SEO sales call
I was born a salesperson. Growing up in Texas, my dad had me working at Trader’s Village, selling everything from belt buckles to hat pins (and every other trinket you can imagine).
You didn’t have to know much about the product. You just needed to know how to haggle pricing.
Selling SEO services is different. You must have a keen understanding of the product/service you represent. And very importantly, you must understand how (or if) an SEO effort can benefit the prospects you’re speaking with.
If you’re not one of the agencies that send a one-sheeter to show the various SEO packages you offer, you are trying to customize an approach for your prospects. In my opinion, we should do a bit of heavy lifting before having our initial calls with prospects. This article will provide some thoughts on how you may want to approach the initial call.
Initial questions to ask the prospect
First, I recommend that you ask your prospect to provide some initial information so that you can do the homework for the initial call. It’s helpful if the prospect has already provided you with an RFP detailing the scope, in-house team capabilities and availability for the SEO effort. If they haven’t completed an RFP, you can download the SEO RFP at my company’s blog and re-brand it/use it as a template for what you may want to provide them.
In lieu of that kind of information, you should begin by asking (at least) these four questions:
- What are you hoping to accomplish with this SEO effort?
- Who are some competitors that you believe to be doing well?
- What type of in-house support do you have for this effort?
- What have you done (if anything) historically for SEO? (Perhaps they have current activity?)
With this information, you can dig into things and determine how you will shape the call.
Do the research
I begin by looking at the prospect’s website. I want to check to see if there’s any quirkiness. Let’s call this a “mini-audit.”
Should you provide “work product” on a sales call? Honestly, I’ve debated this question back and forth for many years. I’ve settled on the thought that folks still don’t trust SEOs, and we must spend a little more effort to establish trust (and to educate). So I see this as “you must give before you get.” It’s good karma.
What’s involved in a mini audit? A few things:
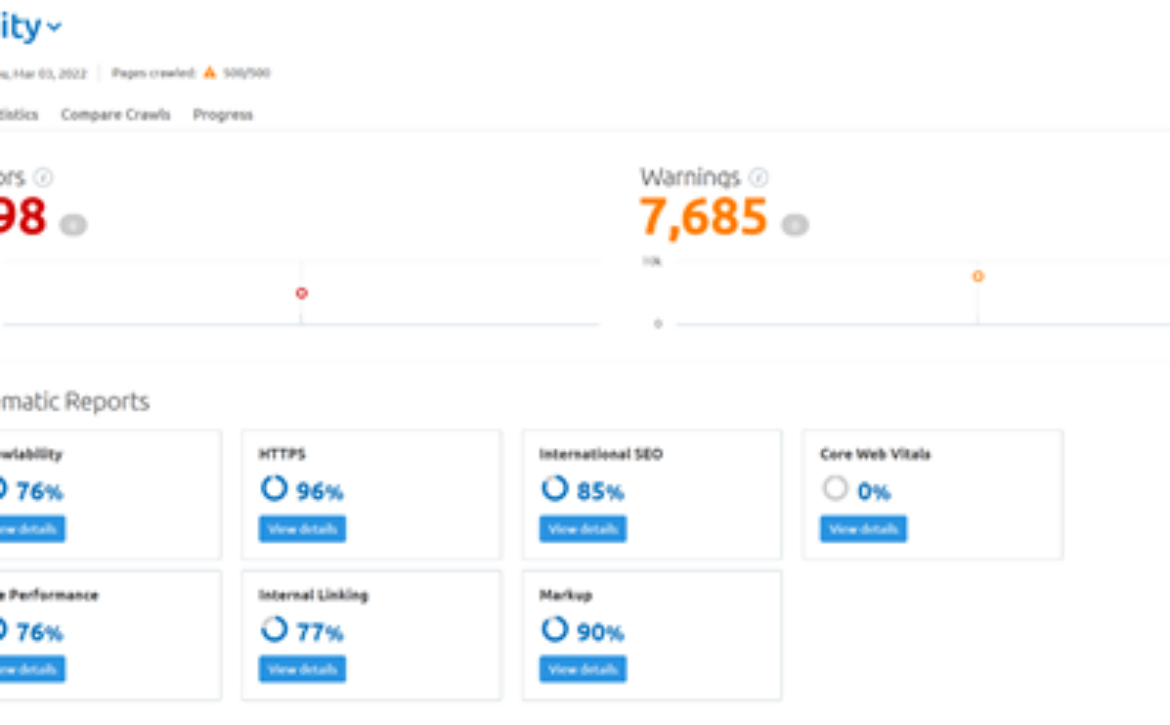
Run a crawl on the prospect’s website
I use Semrush. I limit the crawl to 500 pages, just enough to get a sense of their website’s “brokenness.”
Perform site queries on their domain (and for their competitors)
When running site queries, if you’re unfamiliar, you search on Google for site:www.sitename.com and/or site:sitename.com. You will see the URLs that Google is aware of.
An example of something that you may be looking for would be finding subdomains when searching non-www (i.e., staging.sitename.com). You may find other weird URLs or subdomains showing in the results, so look at them critically.
Highlighting these opportunities to clean up the search results and make their brand shine could lead to a new client relationship. They will appreciate your ability to be inquisitive.
Investigate their organic performance
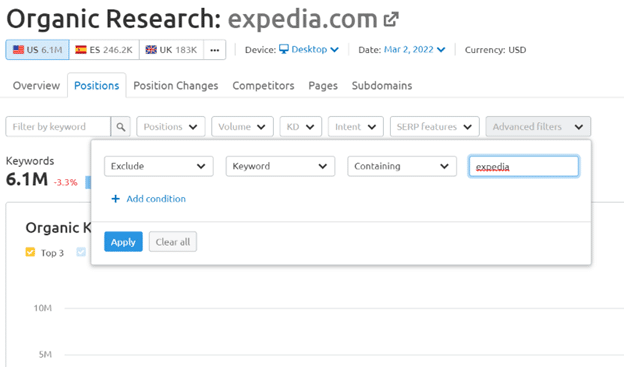
I run a Semrush Organic Overview report for the prospect and their competitors.
Make sure to filter to exclude any brand mentions:
How much “traffic cost” are they realizing versus their competitors? Here’s what that looks like, comparing Travelocity to Expedia:


The “Traffic Cost” metric is Semrush’s attempt to provide a “replacement cost” metric to show the estimated value of your organic presence (i.e., if you had to pay for this traffic via Google Ads, what it could potentially cost you, per month)
How many keywords are ranking in the top 10 (versus their competitors)? Are these “good” keywords or junk?
Run a Domain Comparison report (I use Ahrefs for this) to determine whether the prospect is competitive with those websites/domains.

Suppose you see a competitor doing well with their links. In that case, you should run a quick Site Explorer report via Ahrefs and check some of the “better links” (sort by Domain Authority) and see specific examples for how the competitor is gaining these valuable links. If something is relevant to your prospect, share that on a call as an example of what they may want to consider doing.
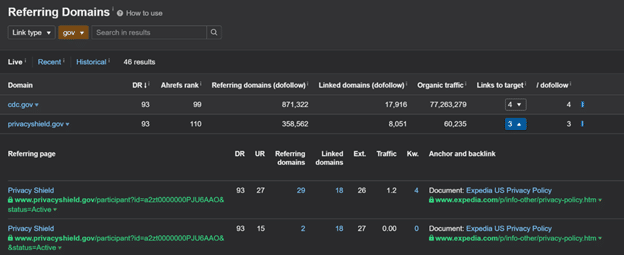
Is there a reason why Expedia has links from CDC.gov and PrivacyShield.gov, and Travelocity does not? At a minimum, you can create some dialogue to learn more about them.
Your goal in doing all the above is to help to identify whether an investment in SEO is viable. Suppose you happen to notice that many of their competitors have a significant organic search presence (greater than your prospect), yet their domain authority is roughly the same. In that case, one could argue that the potential is there. They need to build a better website, create better content or fix technical items standing in their way.
Having the call
The more clarity you can bring to an effort that many marketers see as “the dark arts,” the better. The more people understand how SEO works, the more likely they will invest in it.
If it remains confusing, they are more likely to choose the cheaper (one-sheeter) SEO plan.
For this reason, I typically host these calls via GoToMeeting. I’ll share my screen, share my research, take their questions and answer them directly (perhaps even by conducting additional research on the call with them).
The idea of the mini audit isn’t to give everything away. The idea is to show an example of how you look into things that you may want to address during the SEO engagement (and show them that you’re capable of finding opportunities).
Real-world example
I recently received an inquiry from an e-commerce company. They were sure they had been hit by Google’s July 2021 Core Update. I confirmed via Semrush that they had lost a significant presence in Google. I also confirmed via archive.org that they made substantial changes to their website navigational structure at that same time.
So, was it the Google update? Or, as is more often the case, were they not aware that the navigational changes they made impacted their organic presence.
I gave them this free advice, hoping that they will determine that I’m an honest broker and, because of that, they will want to do business with my agency.
If they don’t do business with us and take the free advice and run, I kind of figure that they aren’t the kind of folks that I would want to work with anyhow.
At least I’ve done my part to spread some positive mojo. Give before you get.
Summary: Selling SEO starts long before the sales call
When selling SEO, be prepared. Preparation is one of the keys to getting new clients. How you do that is by:
- Understanding your prospect: Their wants, needs, resources and SEO history.
- Doing your research: Finding SEO issues and opportunities.
- Demonstrating your professionalism: Your expertise, honesty, process and curiosity.
Once you’ve successfully sold those SEO services, the real work can begin. Go out and help your clients succeed!
The post How to prepare for an SEO sales call appeared first on Search Engine Land.


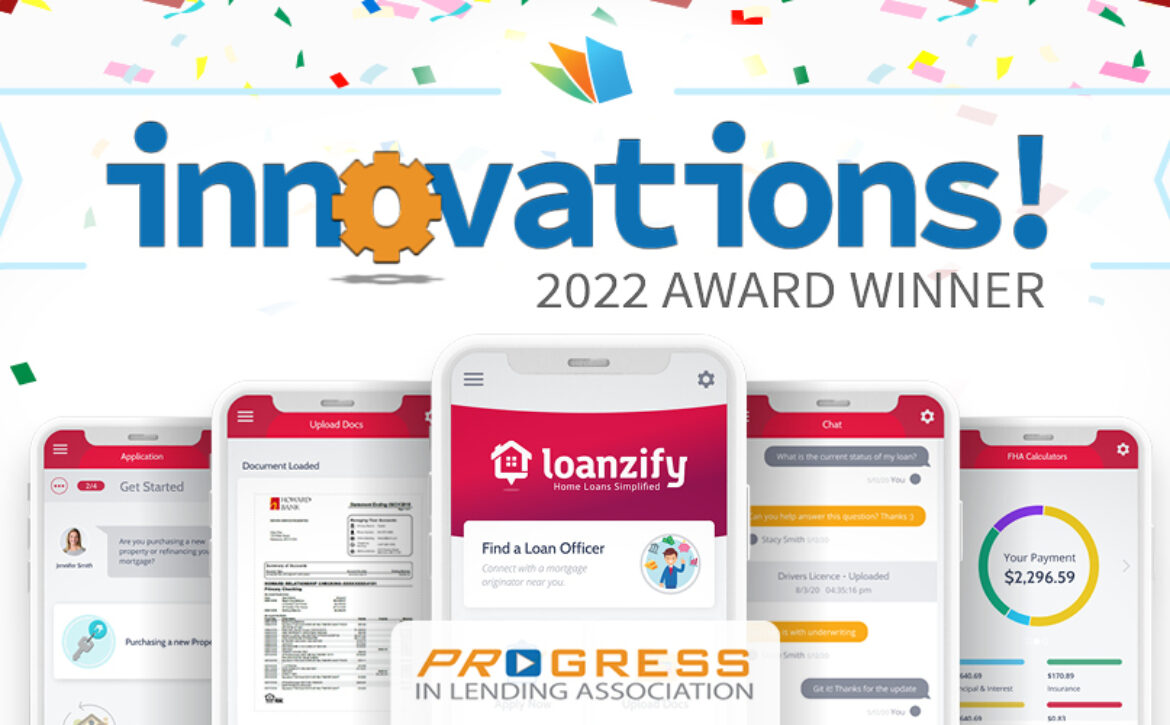
 Awarded by PROGRESS in Lending, earning this honor was based on innovation’s overall impact on the mortgage industry including its significance, originality, and overall positive influence as well as the intangible efficiencies –such as cost and time-saving –achieved as a result of the innovation.